Farmed area = ha
Stock net live weight exported per year (exports – imports)
| Fertiliser | N% | P% | K% | S% |
|---|---|---|---|---|
| DAP (Di-ammonium phosphate) | 18 | 20 | 0 | 1.6 |
| MAP (mono-ammonium phosphate) | 10 | 21.9 | 0 | 1.5 |
| Superphosphate (Single super) | 0 | 8.8 | 0 | 11 |
| Muriate of Potash (Potassium chloride) | 0 | 0 | 50 | 0 |
| Sulfate of Ammonia | 20.5 | 0 | 0 | 23.5 |
| Sulfate of Potash (Potassium sulfate) | 0 | 0 | 40.5 | 17 |
| Urea | 46 | 0 | 0 | 0 |
| Gypsum | 0 | 0 | 0 | 10 - 15 |
| Rock phosphate | 0 | 13 - 17 | 0 | 0 |
| Product | N% | P% | K% | S% | Ca% | Mg% |
|---|---|---|---|---|---|---|
| Average grain | 2.39 | 0.36 | 0.55 | 0.16 | 0.12 | 0.17 |
| Average hay | 2.18 | 0.29 | 2 | 0.22 | 0.69 | 0.32 |
| Average silage | 2.117 | 0.324 | 2.046 | 0.215 | 0.664 | 0.251 |
| Annual pasture (Rye grass) | 3.74 | 0.55 | 2.33 | 0.28 | 0.79 | 0.24 |
| Barley grain | 1.92 | 0.36 | 0.53 | 0.13 | 0.05 | 0.13 |
| Brassica crop | 3.04 | 0.29 | 3.05 | 0.62 | 1.49 | 0.52 |
| Canola meal | 6.16 | 1.14 | 1.34 | 0.7 | 0.62 | 0.55 |
| Cereal hay | 1.66 | 0.2 | 1.73 | 0.16 | 0.23 | 0.14 |
| Cereal pasture | 0.52 | 4.47 | 0.43 | 0.28 | 0.2 | |
| Cereal silage | 1.76 | 0.32 | 1.9 | 0.18 | 0.28 | 0.19 |
| Cereal straw | 0.65 | 0.1 | 1.2 | 0.09 | 0.22 | 0.11 |
| Clover hay | 2.94 | 0.39 | 2.62 | 0.18 | 1.35 | 0.24 |
| Legume pasture | 4.59 | 0.67 | 2.47 | 0.21 | 2.22 | 0.29 |
| Livestock (liveweight) | 2.2 | 0.8 | 0.23 | 0.4 | 1.44 | 0.04 |
| Lucerne hay | 3.42 | 0.36 | 2.08 | 0.28 | 1.25 | 0.39 |
| Lucerne pasture | 4.38 | 0.46 | 1.72 | 0.38 | 1.45 | 0.45 |
| Maize silage | 1.21 | 0.26 | 0.99 | 0.1 | 0.19 | 0.19 |
| Milk in the Vat | 0.522 | 0.091 | 0.142 | 0.038 | 0.113 | 0.011 |
| Oat Hay | 1.38 | 0.2 | 1.72 | 0.14 | 0.24 | 0.15 |
| Oats grain | 1.71 | 0.35 | 0.54 | 0.15 | 0.04 | 0.13 |
| Oats pasture | 5.3 | 0.95 | 5.94 | 0.35 | 0.53 | 0.31 |
| Palm kernels | 2.59 | 0.65 | 0.69 | 0.21 | 0.41 | 0.32 |
| Pasture hay | 1.67 | 0.25 | 1.7 | 0.21 | 0.48 | 0.2 |
| Pasture silage | 2.62 | 0.38 | 2.74 | 0.28 | 0.59 | 0.24 |
| Pellets Calf | 3.12 | 0.63 | 0.81 | 0.26 | 1.43 | 0.33 |
| Pellets Dairy | 2.39 | 0.59 | 0.63 | 0.21 | 1.49 | 0.5 |
| Ryegrass pasture | 3.71 | 0.45 | 2.8 | 0.34 | 0.55 | 0.29 |
| Triticale grain | 2.16 | 0.3 | 0.48 | 0.16 | 0.04 | 0.13 |
| Turnips crop | 2.1 | 0.27 | 2.91 | 0.55 | 0.95 | 0.3 |
| Wheat grain | 2.24 | 0.34 | 0.43 | 0.16 | 0.05 | 0.13 |
| Wool fleece | 17 | < 0.1 | 1.6 | 2.9 | 0.12 | 0.03 |
Farmed area = ha
Stock net live weight exported per year (exports – imports)
| Number | Live weight | Total | |
|---|---|---|---|
| Cows | |||
| Fat steers | |||
| Store steers | |||
| Total (kg/yr) | |||
| Total/area (kg/ha/yr) |
| No. bales | Weight (dry matter) | Total | |
|---|---|---|---|
| Hay | |||
| Silage | |||
| Grain | |||
| Total (kg/yr) | |||
| Total (kg/yr) |
Fodder exported/imported
| Nutrient | Grain (kg/tonne DM) | Fodder (kg/tonne DM) | Live weight (kg/100kg live wt) |
|---|---|---|---|
| Phosphorus | 3.6 | 3.24 | 8 |
| Potassium | 5.5 | 20.46 | 1.8 |
| Sulphur | 1.6 | 2.15 | 1.5 |
Nutrients exported/imported
| Nutrient | Livestock (100kg live wt) | Fodder (tonne DM) | Grain (tonne DM) | Total (Kg) |
|---|---|---|---|---|
| Phosphorus | ……. X 8 | ……. X 3.24 | …… X 3.6 | |
| Potassium | …….X 1.8 | ……. X 20.46 | ……X 5.5 | |
| Sulphur | ……. X 1.5 | ……. X 2.15 | ……X 1.6 |
Nutrients exported/imported
| Nutrient | Kg/ha/yr |
|---|---|
| Phosphorus | 15 - 20 |
| Potassium | 15 |
| Sulphur | 12 |
Nutrients exported/imported
| Nutrient | Liveweight + fodder + soil (Kg/ha/yr) | Total (Kg/ha/yr) |
|---|---|---|
| Phosphorus | ||
| Potassium | ||
| Sulphur |
Fertiliser nutrient required
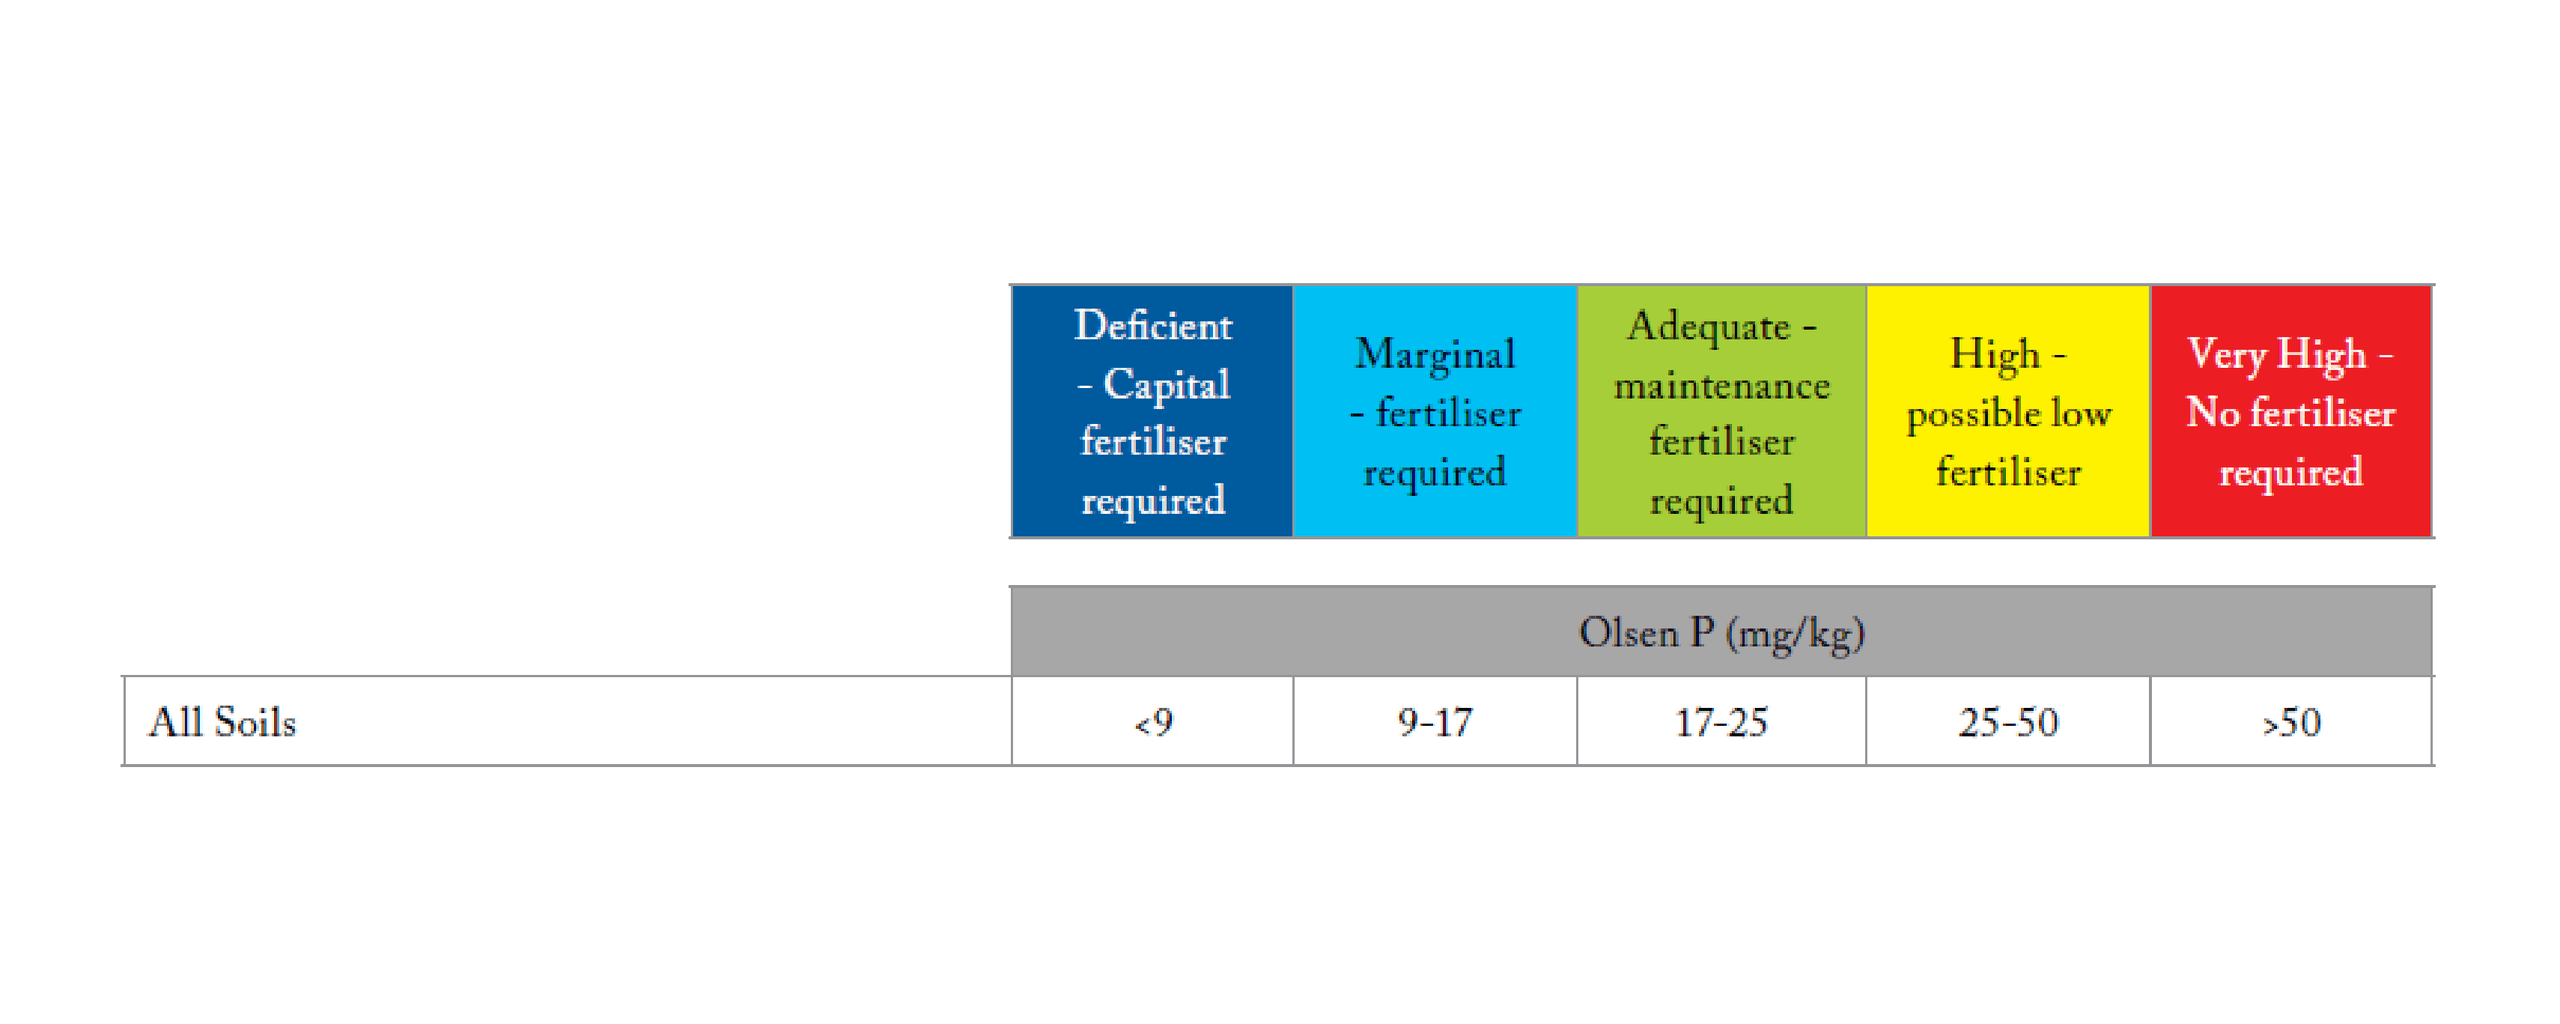
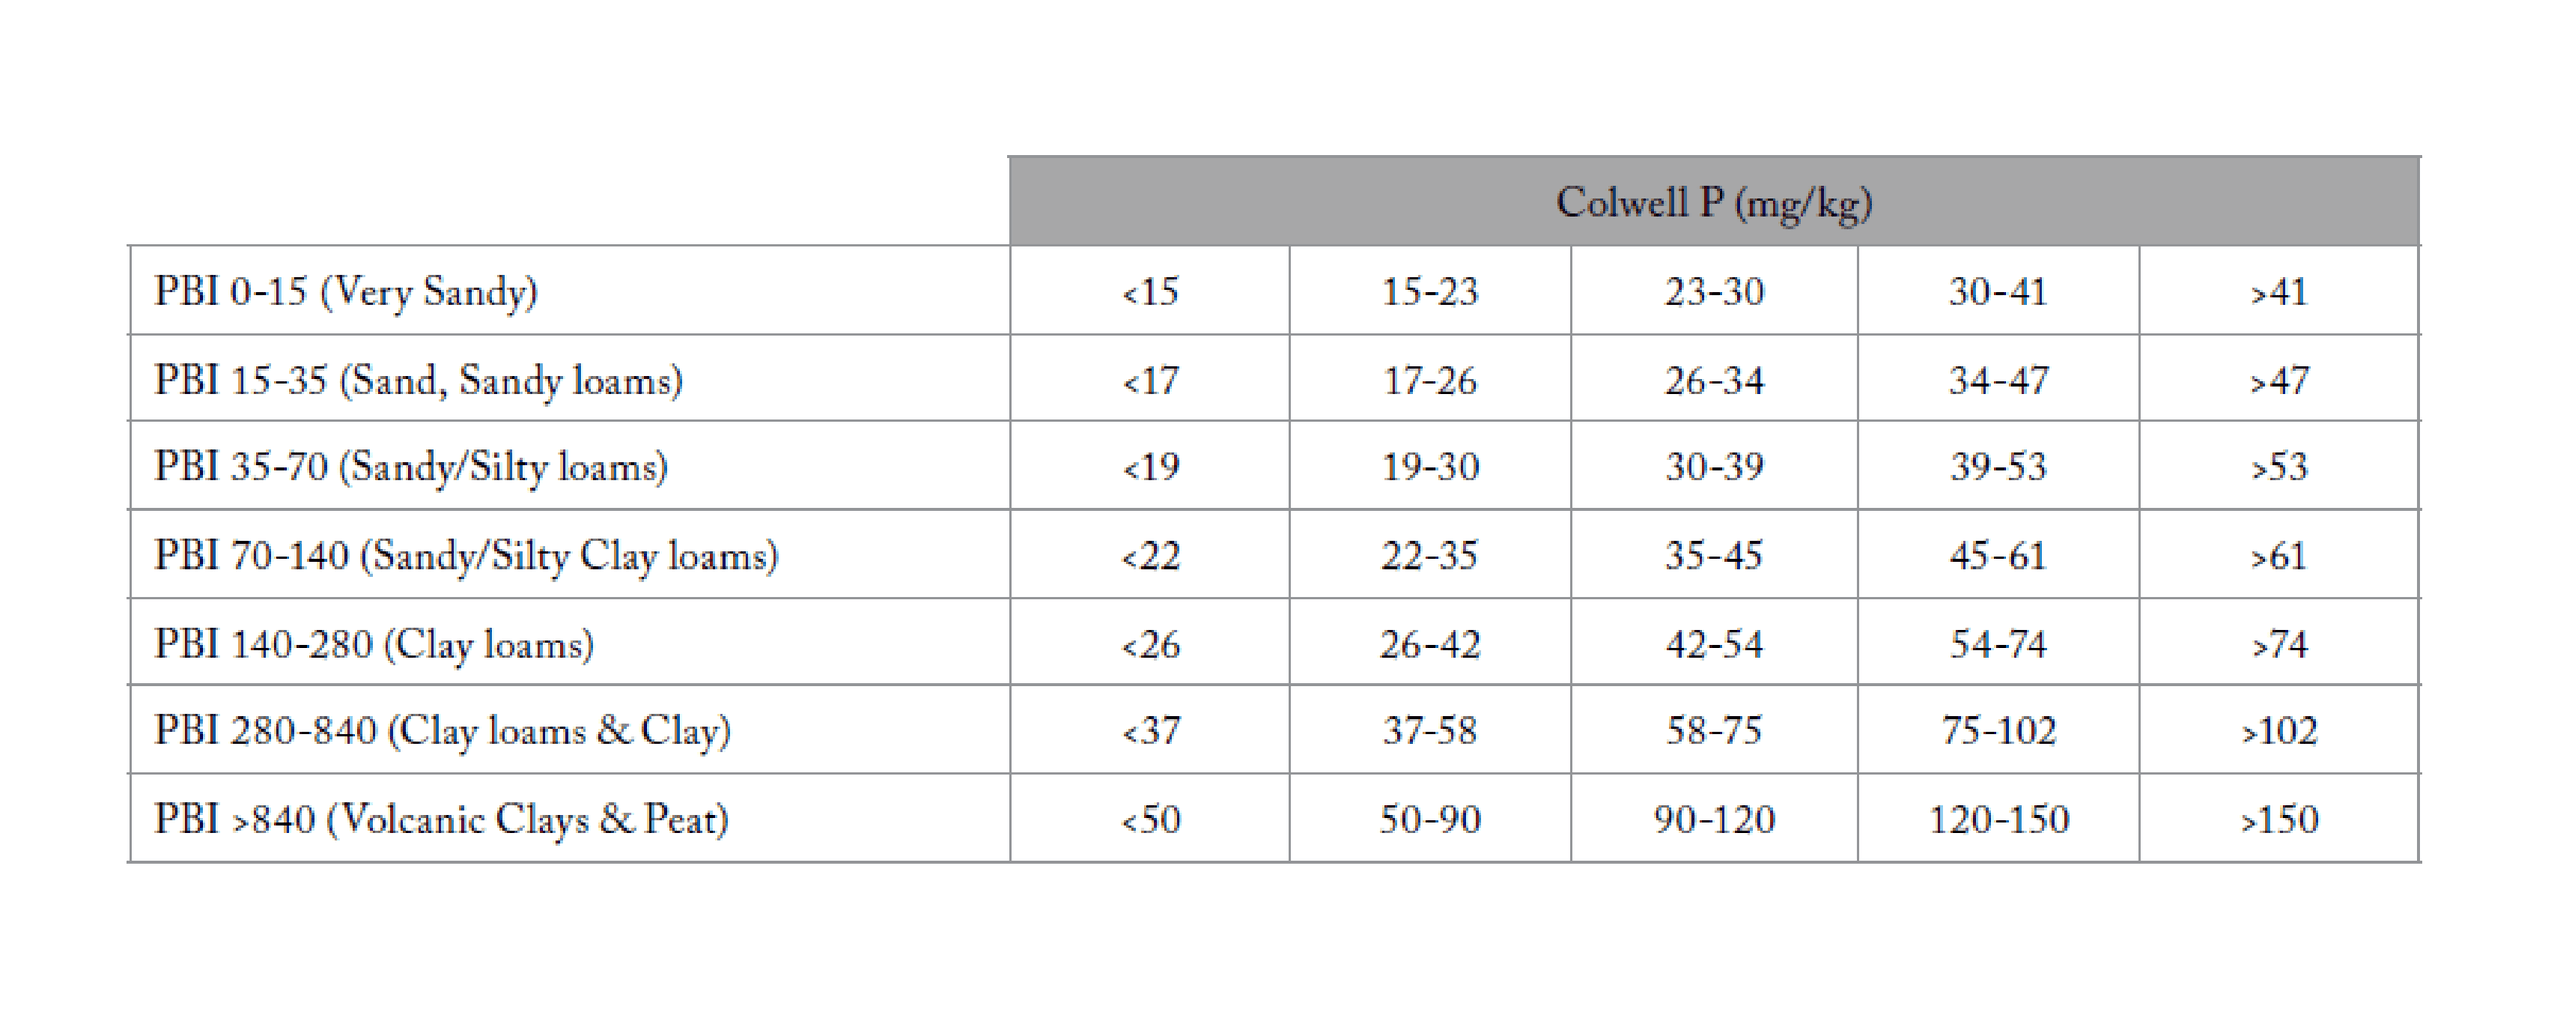
Check soil test results
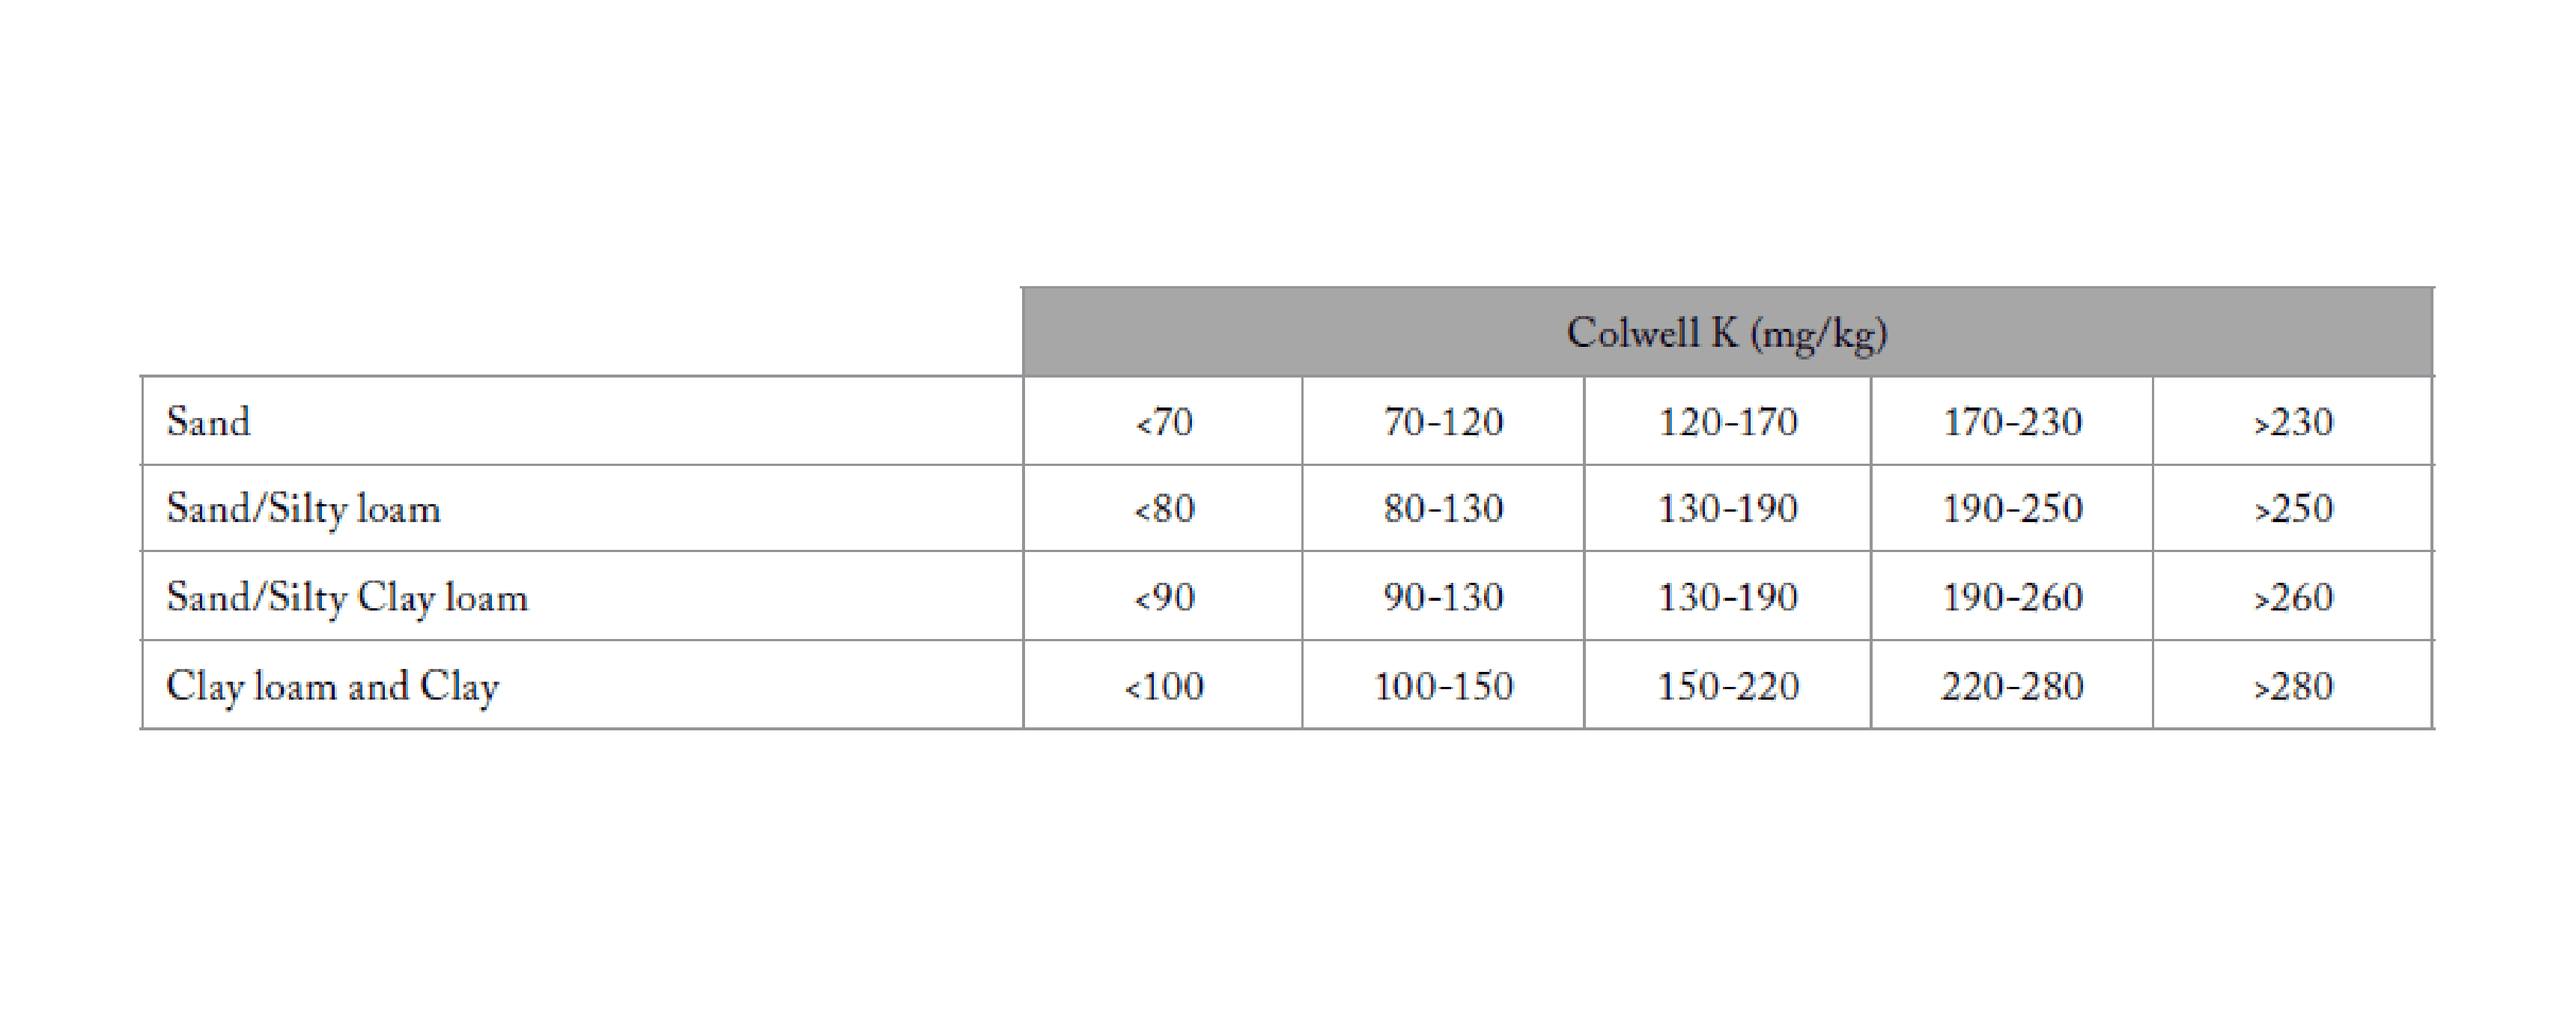
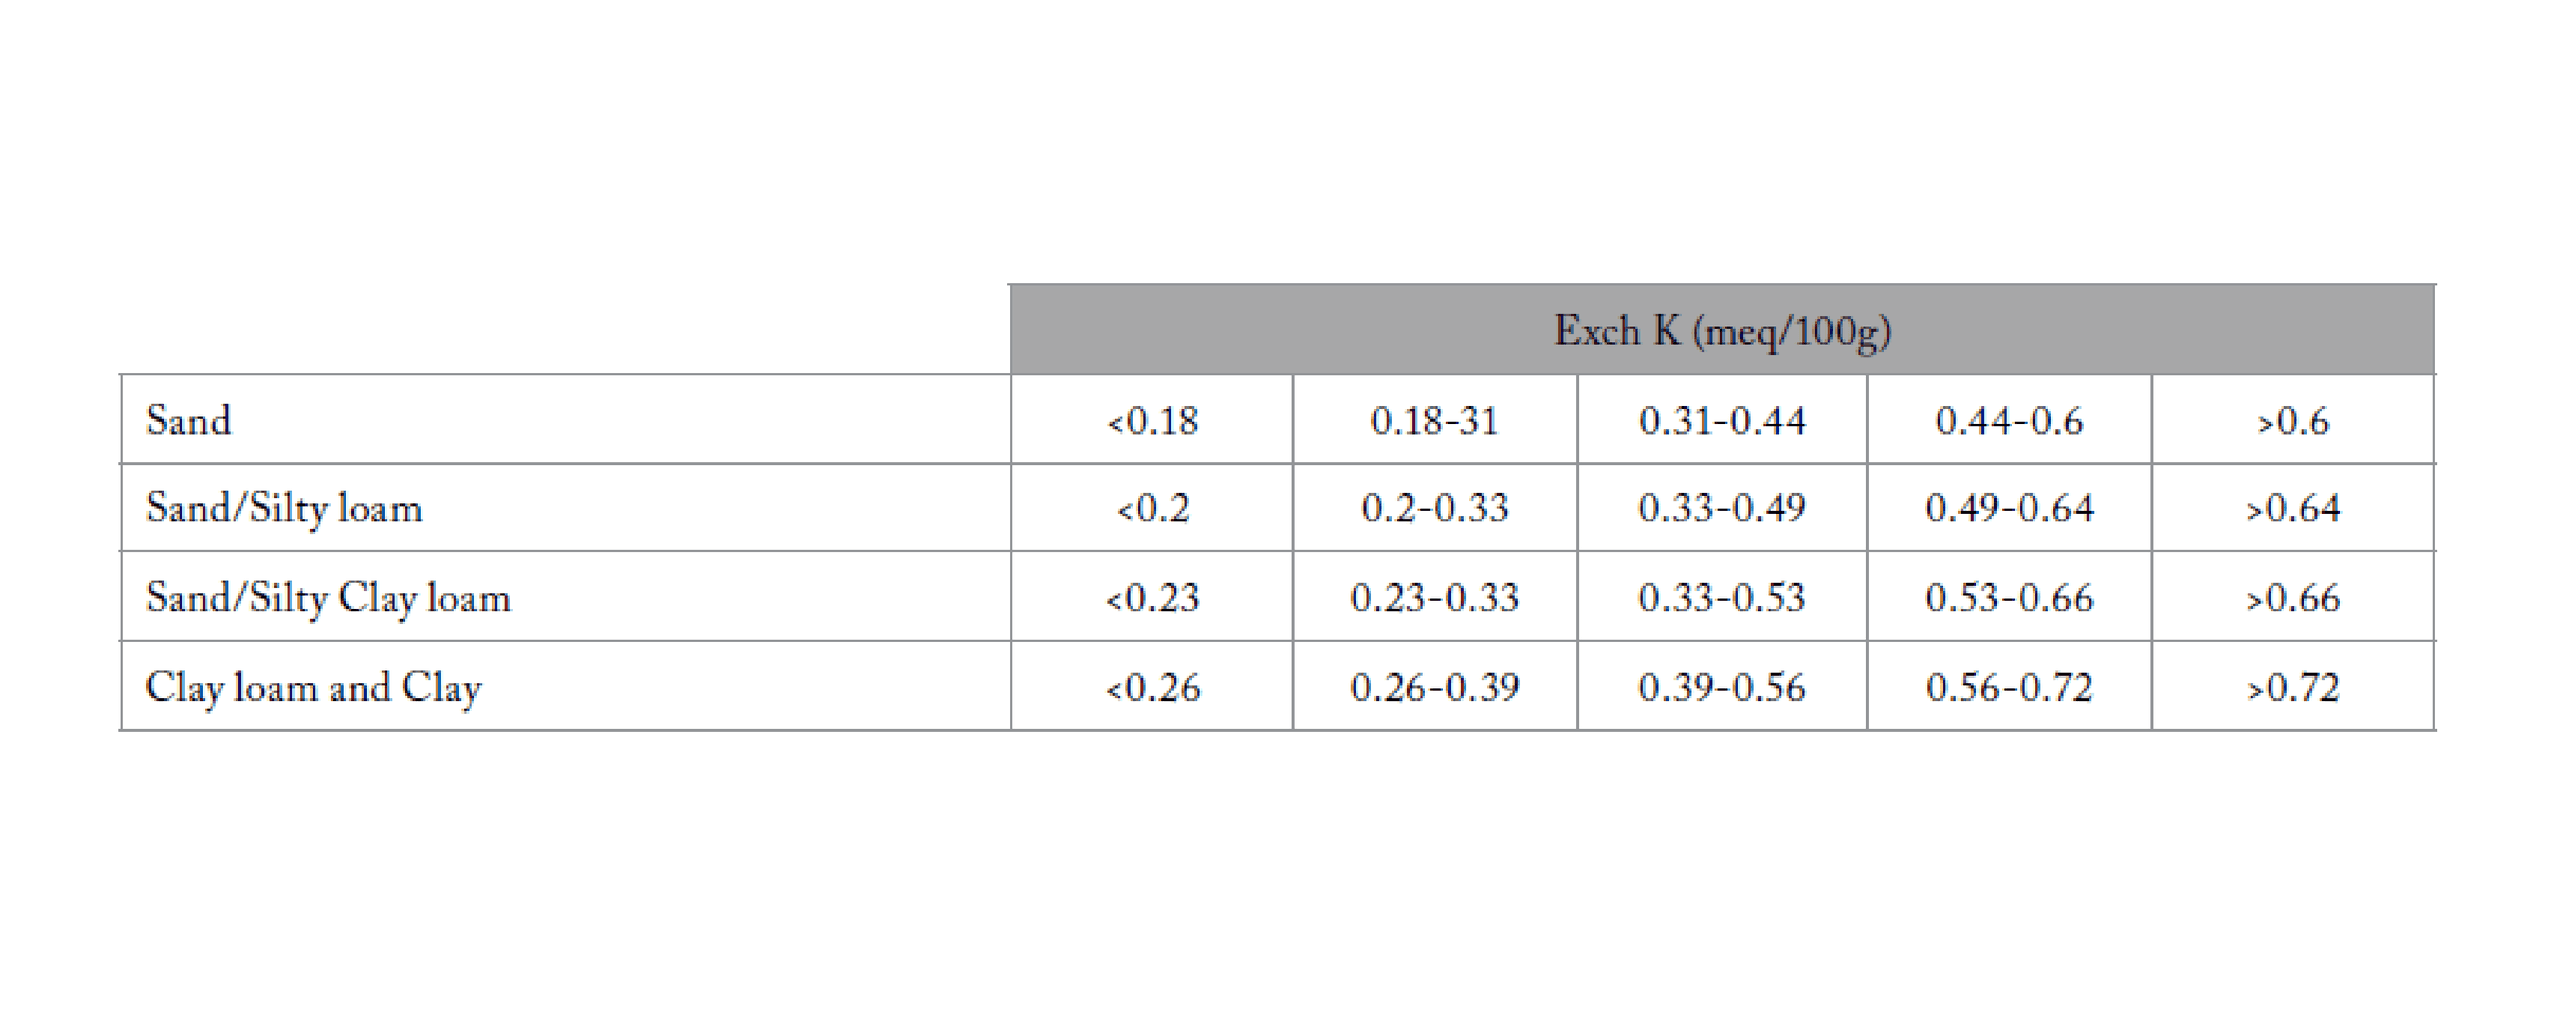
Are Olsen P/Colwell P, Colwell K in optimum range?
Yes – apply maintenance fertiliser
No – above optimum, do not apply fertiliser
No – below optimum, apply maintenance plus capital fertiliser
| Fertiliser | N% | P% | K% | S% |
|---|---|---|---|---|
| DAP | 18 | 20 | 0 | 1.6 |
| Grassbooster | 29.7 | 0 | 0 | 14.6 |
| Hayboosta | 11.8 | 4.7 | 23.6 | 4.6 |
| MAP | 10 | 21.8 | 0 | 1.5 |
| Muriate of Potash | 0 | 0 | 50 | 0 |
| Pastureboosta | 23.8 | 3.7 | 12.8 | 4 |
| Sulphate of Ammonia | 20.5 | 0 | 0 | 23.5 |
| Sulphate of Potash | 0 | 0 | 40.5 | 17 |
| Superphosphate (Super) | 0 | 8.8 | 0 | 11 |
| Urea | 46 | 0 | 0 | 0 |
Fertiliser nutrients
Fertiliser required
| Fertiliser | Salt Index |
|---|---|
| Sodium nitrate (NaNO3) (standard base) | 100 |
| Ammonium sulphate (SoA) | 68 |
| Urea | 74 |
| Superphosphate | 8 |
| Diammonium phosphate (DAP) | 29 |
| Monoammonium phosphate (MAP) | 27 |
| Potassium chloride (muriate of potash, MOP) | 116 |
| Potassium sulphate | 43 |
| Gypsum | 8 |
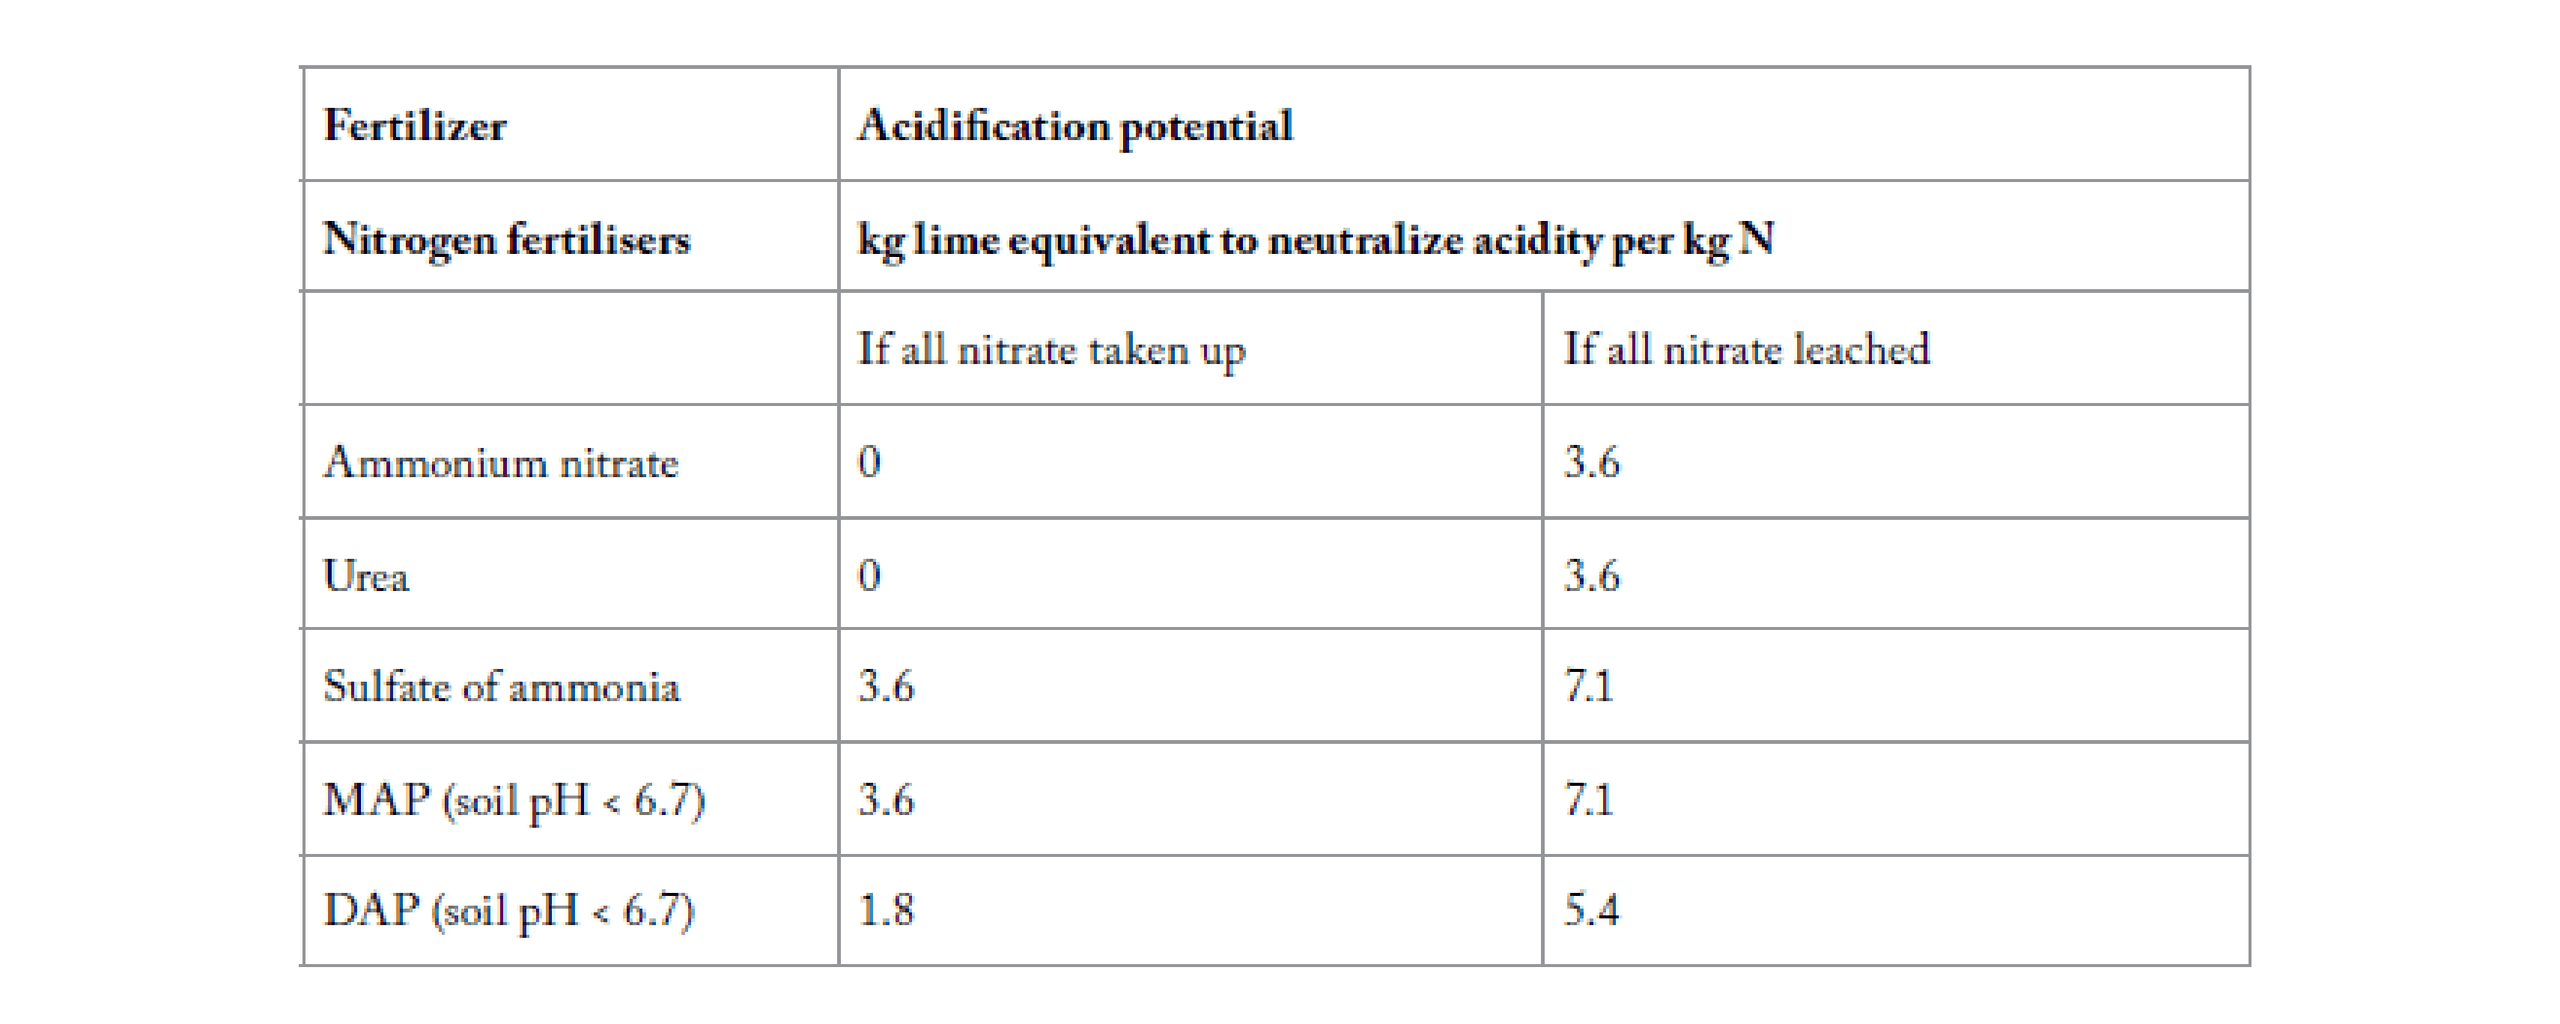
| Phosphorus fertilisers | kg lime equivalent to neutralize acidity per kg P Soil pH <6.7 |
|---|---|
| SSP / Triple SP | 0 |
| MAP / DAP | 1.6 |
| Sulfur fertilisers | kg lime equivalent to neutralize acidity per kg S |
|---|---|
| Sulfate of ammonia | 0 |
| Elemental S | 3.2 |
| Ammonium thiosulfate | 4.8 / 3.2 (nitrate leached / taken up) |
| Gypsum | 0 |