- Farm records of fertiliser, soil amendment and stock feed purchases plus product harvest and sales are required for a farm nutrient budget.
- Paddock specific nutrient budgets require records of application rates of fertilisers and soil amendments and total yields or pasture dry matter removal (= biomass removal) per paddock and crop or time period (e.g. year).
- A nutrient budget provides an estimate of the maintenance rate of each fertiliser nutrient that needs to be applied annually or per crop in order to maintain soil test levels in the optimum range.
- If soil test levels need to be raised, capital fertiliser or soil or amendments are required above maintenance rates to increase the soil test level into the optimum range.
Key Points
Background
A nutrient budget calculates the balance between inputs and outputs of nutrients over a chosen area and time period. This area may be one paddock, especially when growing crops, a sub-catchment or a complete farm. The sum of nutrient inputs and outputs enables the determination of nutrient surpluses and deficits. A nutrient budget can help with management decisions such as which paddock is best suited to hay cutting in order to reduce an excess of nutrients or which paddock is best suited for particular crops. There are several nutrient budgeting tools available including Back Paddock (2023) SoilMate, LandWISE (2023) Nutrient Budget Templates, OVERSEER® (2023), plus proprietary in-house tools used by commercial companies and research agronomists. A nutrient budget will allow for differentiation between ‘maintenance’ and ‘capital’ fertiliser required or indicate if nutrients can be ‘mined’ if there is a surplus.
Nutrient inputs to a farm are mainly in the form of fertiliser, soil amendments and stock feed, while the outputs are product removal, (grain crops, vegetables, livestock, fruit, milk and wool) and environmental losses. Losses to the soil exchange complex, leaching and inefficiencies around an intensively used farm (e.g. laneways) can be significant and should be accounted for and controlled as much as possible. Losses can be influenced by many factors including rainfall timing and intensity, season, soil type, slope, soil moisture, ground cover, pasture height, crop growth stage, time after fertiliser application and type and method of application of fertiliser applied (Havilah et al. 2005).
Nutrient budgeting relies on testing of soil nutrient reserves and crop or product removal rates, but it does not account for inefficiencies in nutrient availability that might arise due to other factors such as soil compaction or surface sealing, soil borne diseases that affect root health, salinity, nutrient imbalances, chemical fixation or leaching losses.
Analysis of whole farm nutrient budgets on Tasmanian dairy farms found that application of individual nutrients in the year prior to soil sampling ranged from annual deficits to large annual surpluses for P, K and S. Phosphorus budgets ranged from a deficit of 37 to a surplus of 51 kg/ha/yr, K budgets from a deficit of 32 to a surplus of 76 kg/ha/yr, and S budgets from a deficit of 14 to a surplus of 80 kg/ha/yr (Cotching et al. 2017).
There is also an opportunity to reduce N input and N2O emissions in high fertiliser input vegetable systems without compromising vegetable yield (Suter et al. 2021). Nutrient budgeting and split fertiliser applications guided by needs at key growth stages are an important tool for reducing nutrient inputs and losses, thus improving nutrient use efficiencies.
Information required for a whole farm nutrient budget for grazing systems:
- Farm map or plan. Most farmers have a detailed farm and paddock map, but if not, satellite images plus farm and paddock boundaries are accessible online at:
https://maps.thelist.tas.gov.au/listmap/app/list/map
- The land area (hectares) directly contributing to production. On a dairy farm this is known as the milking platform. This includes grazed and harvested forage (pasture and crops) and designated feeding and sacrifice areas but excludes areas of bush/native vegetation and farm dams.
- The soil types occurring across the farm.
- Farm production characteristics including grazing system (rotational or set stocking).
- Fertiliser and stock feed purchases (grain, pellets, hay, silage, straw, compost), herd size (stocking rate), animal sales, and milk, forage and crop quantities sold (i.e. dry matter production).
- Identified current and previous paddock use and management, such as effluent and effluent pond sludge disposal areas.
- Soil test reports and interpretations for individual paddocks or management zones, or collection of soil samples and soil analysis.
- Assessment of pasture/crop and soil condition including soil structure and drainage in order to identify any limiting factors to production.
The mass or volume of imported and exported nutrient sources can usually be determined from farmer records, but the nutrient concentrations are normally sourced from lookup tables provided by commercial suppliers as well as published and scientifically credible industry standards. An example is given in Appendix 2. The Australian Soil Fertility Manual (2006) provides information on typical nutrient removal rates for a range of crops and livestock.
Steps to calculate a whole farm nutrient budget for grazing systems:
- Measure areas of production (hectares).
- Access records of inputs of feed and fertiliser.
- Calculate amount of nutrient imported as fertiliser from the bag’s label, supplier of soil amendments or from Appendix 1.
- Nutrient imported as fertiliser (kg) = tonnes fertiliser x nutrient content (%) x 100
- Calculate amount of nutrient in each feed from its analysis or from Appendix 2.
- Nutrient imported as feed (kg) = tonnes ingredient x nutrient content (kg/t)
- Add results from step 3 and 4
- Calculate amount of nutrient lost as product from Appendix 2 or other reference material.
- Nutrient exported = tonnes product x nutrient content (kg/t)
- Subtract exported nutrient (step 6) from imports (step 5) to estimate balance.
- Divide by area (hectares) of the farming operation.
The balance of nutrients calculated provides an initial estimate of the maintenance rate (kg/ha) of each fertiliser nutrient that needs to be applied annually to pastures in order to maintain soil test levels in the optimum range.
Maintenance vs capital fertiliser
Maintenance fertiliser application should replace nutrients removed in produce plus satisfy the soil retention factor that depends on your soil test result for P and S (Table 1), and soil type for K (Table 2). On dairy farms, maintenance fertiliser also needs to replace nutrients lost from dung and urine in laneways. The P and S lost in laneways is estimated by multiplying the stocking rate by 0.8; e.g. 2 cows/ha x 0.8 = 1.6 kg P/ha. The K lost is estimated by multiplying the stocking rate by 6.5.
--------------------------------------- Phosphorus (Olsen P: 0-100 mm sampling depth)
| 10-12 | 13-15 | 16-20 | 21-30 | 31-42+ | |
|---|---|---|---|---|---|
| Sand | 6 | 8 | 9 | 10 | 10 |
| Sandy Loam | 10 | 15 | 18 | 20 | 20 |
| Clay Loam | 13 | 20 | 23 | 25 | 25 |
| Clay/Red Soil | 16 | 24 | 28 | 30 | 30 |
Table 1. Soil phosphorus (P) retention factors for maintenance fertiliser applications.
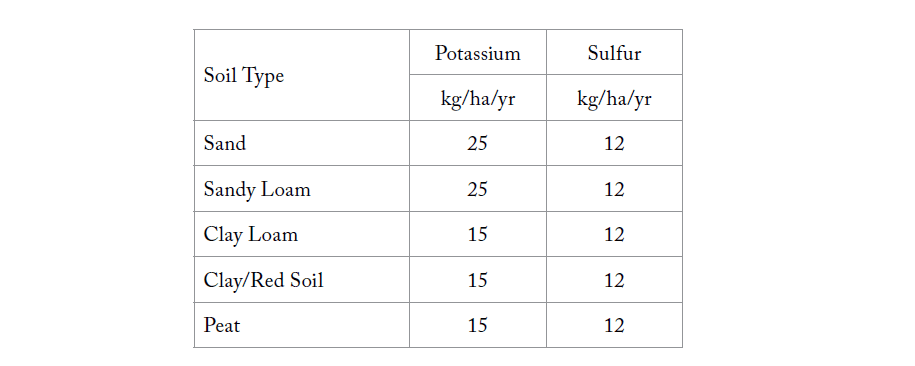
Table 2. Amount of potassium and sulfur (kg/ha/yr) required to satisfy the soil retention factor over a range of soil textures.
Capital fertiliser is the fertiliser required, additional to maintenance, to increase the soil test level into the optimum range (Tables 3 and 4). In most situations applying capital fertiliser will be done over 2-3 years or more as the fertiliser cost can be significant allowing the cost to be put into future farm budgets. Two kg of potassium (K) fertiliser is required to raise the soil K level by one Colwell unit (mg/kg) on all soil types. It has been found to be difficult to raise the P soil test level on sand soils that have very low PBI. On these light sand soils, P can be lost rapidly via leaching. These soils respond better to frequent and lighter applications of P fertiliser (Luke Taylor pers. comm.)
| PBI | Amount of P fert to raise Olsen P by 1 unit kgP/ha | Amount of P fert to raise Colwell P by 1 unit kgP/ha | |
|---|---|---|---|
| Sand | < 50 | 6 | 22 |
| Sandy loam | 50-100 | 8 | 23 |
| Sandy clay loam | 100-300 | 9 | 25 |
| Clay loam | 300-400 | 10 | 28 |
| Clay/red soil | >400 | 12 | 32 |
Table 3. Capital phosphorus (P) fertiliser required to increase soil test value from below optimum into the optimum range.
| Sulfur soil test level (KC1-40 test) (mg/kg) | Sulfur required (kg/ha) |
|---|---|
| 0-4 | 30 |
| 4-9 | 15 |
| 9-13 | 7 |
| >13 | 1 |
Table 4. Amount of capital sulfur (S) fertiliser required based on soil test result.
Calculating the amount of fertiliser required
In Australia, mineral fertilisers are labelled with the actual percentage of N, P, K, S, Ca and Mg. If the fertilisers contain trace elements, their percentages are added. Some fertilisers may contain elements that are not required by plants, e.g. Muriate of potash (KCl) contains 50% chloride. Australia has a National Code of Practice for Fertiliser Description & Labelling, prepared by Fertiliser Australia (2018). This information can be used to calculate the amount of a fertiliser needed for a given amount of nutrient.
Amount of fertiliser (kg/ha) = kg/ha nutrient ÷ % nutrient in fertiliser x 100
Example: You need 20 kg/ha of phosphorus and you plan to use superphosphate with 8.8% P. Amount of superphosphate required (kg/ha)
= 20 kg/ha ÷ 8.8% P x 100
=227 kg superphosphate/ha
An example worksheet is available in Appendix 3.
How much nutrient in a fertiliser becomes available to a plant is dependent on the chemistry of the nutrient and its surrounding environment. Chemical factors involved are solubility of the product, salt index and pH, that are all related to electrical charge. These factors are all interrelated, the higher the electrical charge, the higher the salt index and its solubility, and the greater the possible effect on pH. Detailed information on fertiliser solubility is published by Soil Wealth & Integrated Crop Protection (2022). Mineral fertilisers are mostly salts (apart from urea) that ionise (dissociate) into the anion (+) and cation (-) components when in contact with water. The strength of this electrical charge (e.g. 2+, 4-, etc.) affects both the interaction with the soil and transport into the plants via roots and leaves. Urea is also water soluble but it does not dissociate and so it does not interact with cation or anion exchange sites in the soil. Nutrient availability from soil amendments varies widely depending on the type of amendment, it’s status (e.g. decomposition of organic materials) and environmental conditions. It is important to note that nutrients can be lost to the environment from organic amendments, if oversupplied.
Broadcast vs direct placement
Fertiliser nutrients respond differently in different soil types. Consequently, on high P-fixing soils (Ferrosols) much of broadcast P fertiliser may not be available to a crop, especially during early growth stages when root systems are small. Direct placement of fertilisers with seed at planting, e.g. banding P in potatoes, provides agronomic benefits in this instance.
If fertiliser P is applied some time ahead of planting, much of the applied P may be fixed by the soil and in the case of N or K fertiliser, the nutrient may be leached out by heavy seasonal rainfall prior to the crop being planted. Direct placement of fertilisers can potentially lead to better nutrient utilisation and reduced product costs due to better accessibility by roots.
Salinity and salt index (SI)
General management of soil salinity is covered in my earlier book (Cotching 2009). The Salinity Glovebox Guide (NRM North 2009) is a useful information source for landholders, land managers and natural resource management advisers. The higher the fertiliser’s salt index the more it will increase the salinity of the soil solution. Generally, this effect is not ideal and using fertilisers with a lower salt index is preferable. The SI indicates which fertilisers (those with a higher SI) might cause injury to germinating seeds or seedlings if the product was placed close to, or in, the planting row. The SI for commonly used fertilisers is shown in Appendix 4. Products with high SI should not be used on saline soils or with crops that are sensitive to a high salt concentration in the soil solution.
Fertiliser blends and compounds
A fertiliser blend consists of a range of primary fertilisers mixed together to achieve a desired nutrient composition. Fertiliser companies offer many standard blends and custom blends are continually created on the advice of accredited advisers and agronomists to match nutritional needs of crops while avoiding the under or over application of some nutrients. Some fertiliser ingredients can or cannot be blended together based on their physical and chemical compatibility and agronomic considerations. Some components absorb a lot of moisture when blended making the blend potentially unstable and difficult to spread. When one component in a blend is low, the blending process may not achieve good uniformity which can result in non-uniform nutrient distribution in the paddock. It is best to keep the number of ingredients in a blend to a minimum and to use one source of phosphorus and one source of potassium. Uniformity of blend quality is best achieved when all the ingredients are closely matched in size, to minimise segregation during handling (Incitec Pivot Fertilisers 2021).
Compound fertilisers differ from a blend as they consist of granules that each contain multiple nutrients. Compound fertilisers do not segregate during transport or application, and they allow for uniform distribution of macro and micronutrients throughout the root zone. Blended fertilisers are the most popular type of fertiliser for pastures and crops with relatively low gross margins. Compound fertilisers are sometimes more expensive than a blend as they require additional processing. However, compound fertilisers may offer advantages of handling, more even application and nutrient release during the growing season. Compound fertilisers are sometimes used at planting with supplementary application of single nutrient fertilisers during the growing season. Compound fertilisers are used in high value horticultural crops.
Coated fertilisers
Coated fertilisers, sometimes known as slow or controlled release fertilisers, provide a prolonged supply of nutrients that may decrease leaching and gaseous losses, reduce the need for multiple fertiliser applications, and provide more uniform plant nutrition from seedling to maturity (Menasha 2011). Coated fertiliser consists of a granular fertiliser as the core, commonly granular or prilled nitrogen fertiliser (urea), and a layer of low water-soluble/insoluble inorganic substance or organic polymer coated on the surface by heating, spraying and drying that varies among manufacturers. The composition and thickness of the fertiliser coating controls the nutrient release rate from weeks to months with the rate of release determined by soil moisture content, soil temperature and in some cases soil microbial activity.
Nitrification inhibitors can also be coated onto urea-based fertilisers. These inhibitors slow the conversion of the ammonium form of mineral N to the nitrate form thus reducing N losses via volatilisation as N2O (the loss of nitrogen to the atmosphere as ammonia gas (NH3) from soils or from fertiliser applied to
the soil surface) or as N2O or N2 once converted to nitrate (denitrification) or leaching as nitrate (NO3)
(Menasha 2011), and so increasing nutrient use efficiency (Rowlings et al. 2016).
Chelated products
Chelation is used to improve the bioavailability of micronutrients or calcium using an organic molecule (chelator) to encircle a trace element nutrient such as copper so that it is protected from undesirable soil reactions. Chelates help a nutrient to remain plant available over a wider pH range particularly iron (Fe) where the metal may be extracted from the chelate compound and travel into the plant. This process may also result in better uptake of other micronutrients such as copper or zinc.
Fertigation
Fertigation is commonly used with drip irrigation systems in vegetable crops to apply nutrients directly to the root zone. Fertigation can result in high nutrient use efficiency and low losses if used correctly. In compacted or sandy soils that have poor lateral flow, fertigation may not work well due to uneven nutrient distribution throughout the root zone.