- Phosphorus is one of the most critical and limiting nutrients in agriculture in Australia.
- Phosphorus reactions in soils are complex, and agronomic advice is recommended when interpreting soil test results.
- Only 5–30% of phosphorus applied as fertiliser is taken up by the plant in the year of application.
- Phosphorus losses via runoff and drainage under dairy production can be high in Tasmania.
Nutrient Management
for Farming in Tasmania - Bill Cotching
5. PHOSPHORUS (BASED ON QUINLAN ET AL. 2012)
Chapters
Key points
Background
Ancient and highly weathered soils with very low levels of natural phosphorus (P) dominate much of Australia. Many of our agricultural soils are therefore among the most acutely phosphorus deficient in the world, and profitable crop production has only been possible through significant applications of P fertilisers. The use of mineral phosphorus fertilisers since the 1950’s has boosted soil-available phosphorus and, thus, agricultural yields. These fertilisers are manufactured by mining and chemical processing of rock phosphate with most of the world’s remaining high-grade phosphate rock concentrated in just five countries and 70% of the rock phosphate located in Morocco. Phosphorus is an essential element for plants and animals for cell division and growth. Complex soil processes influence the availability of phosphorus applied to the soil, with many soils able to “tie up” phosphorus, making it unavailable to plants. The soil’s ability to do this must be accounted for when determining P requirements for crops and pastures.
Deficiency
Phosphorus deficiency can at first be difficult to see in many field crops because while growth is slowed and the crop somewhat stunted, it still looks a healthy colour. Phosphorus is concentrated at the young growth tips, meaning deficiencies are first visible on lower (older) parts of the plant. A purple or reddish colour associated with accumulation of sugars, is often seen in deficient plants, especially when temperatures are low. Leaf distortion, chlorotic (yellowed) areas and delayed maturity are all indicators of phosphorus deficiency in more mature plants. Deficient cereal crops are often poorly tillered. Plant testing is the best way to ensure that a plant has the required level and balance of nutrients. Don’t wait to see deficiency symptoms, as when symptoms appear, the crop has been damaged affecting yield and quality.
Visual symptoms other than stunted growth and reduced yield are not as clear as are those for nitrogen and potassium. Phosphorous deficiency can appear in plants as a purple or reddish pigmentation, delayed maturity, and poor tillering ultimately resulting in reduced crop quality. At some growth stages, phosphorus deficiency may cause the crop to look darker green. The role of phosphorus in cell division and expansion means crop establishment and early growth is highly dependent on sufficient sources of the nutrient. Phosphorus is the least mobile of the major nutrients. As a result, the majority of phosphorus uptake comes from plant roots growing into a source of soil solution phosphorus, as opposed to phosphorus moving to the root hair via soil water movement (Hinsinger 2001). Phosphorus is usually not available to a plant until it is less than 0.1mm from a root hair. This means young plants with few roots that are growing in very coarsely structured soils can struggle to access adequate phosphorus even when good soil reserves are present. Trials have shown significant agronomic penalties from applying phosphorus more than 10 days after germination. Most of these phosphorus timing trials indicate the optimum time for P fertiliser application is shortly before or during seeding.
Fate of applied fertiliser
Phosphorus fertiliser is mostly applied in a water-soluble form which can be taken up by plants, retained by soil and lost through erosion and leaching (Figure 5). In the water-soluble form phosphorus rapidly reacts with iron, aluminium and calcium in the soil, to form insoluble compounds. Therefore, competition between the soil and plant roots for water soluble phosphorus arises, with only 5% to 30% of the phosphorus applied taken up by the crop in the year of application. At low pH (<5.0 water), the soil's ability to fix P forming aluminium and or iron phosphates rises dramatically, thereby decreasing the amount available to plants. Phosphorus availability also decreases above pHwater 7 as phosphorus binds to calcium leaving less free phosphate ions available in solution.
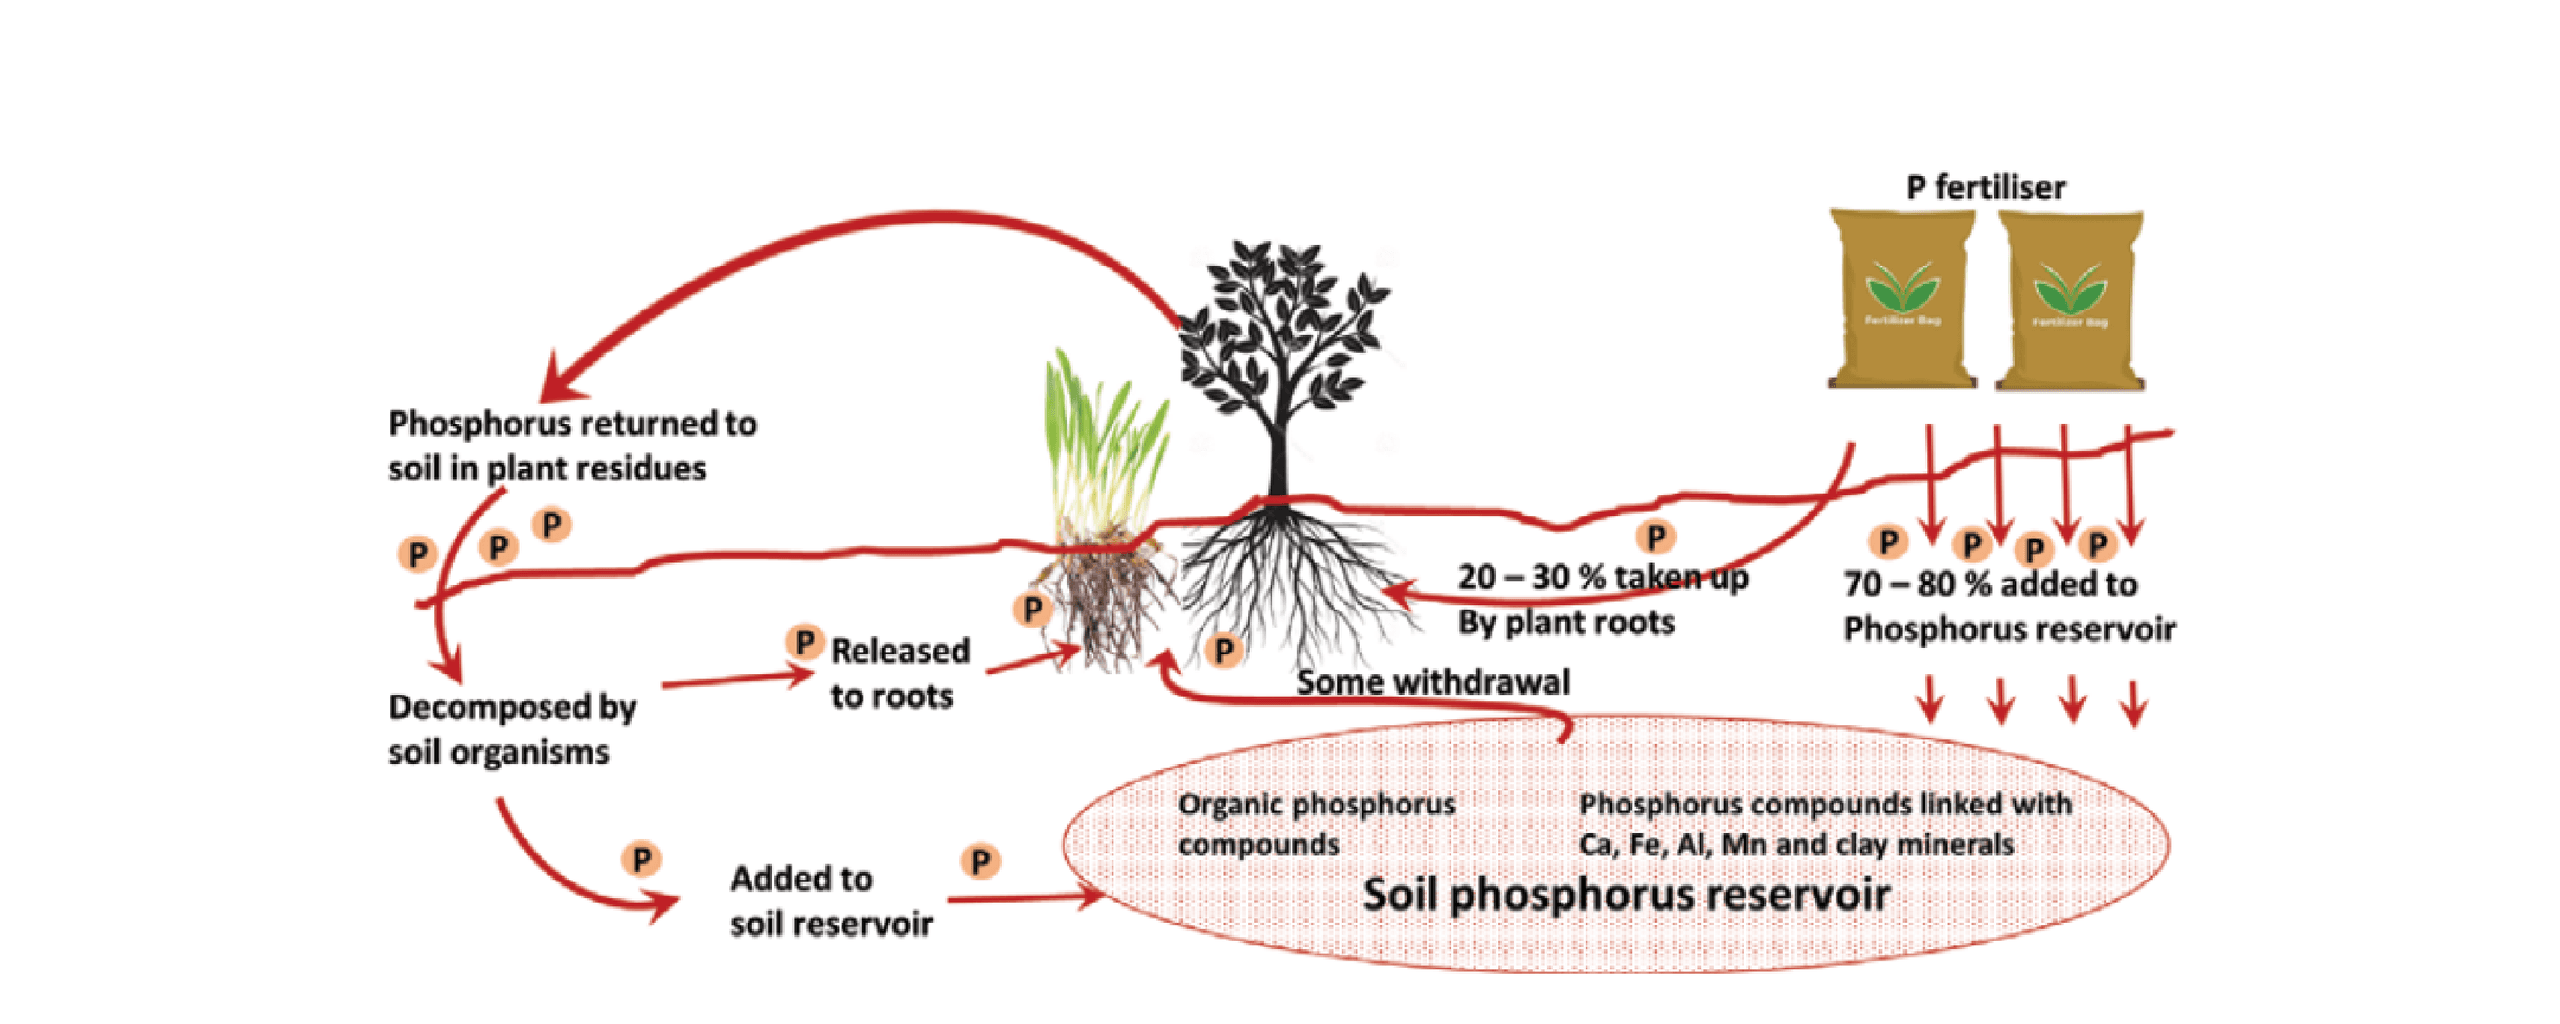
Figure 5. The phosphorus cycle in a typical cropping system is particularly complex, where movement through the soil is minimal and availability to crops is severely limited (from Glendinning 2000).
Testing availability of soil phosphorus
Soil type is one of the primary factors determining the solubility of soil phosphorus. Knowing the soil's ability to fix phosphorus is vital in determining the rates of fertiliser application. A high P fixing soil will require significantly more P-fertiliser to raise levels of plant-available P. A Phosphorus Buffering Index test (PBI) (Burkitt et al.2002) has been developed to determine P fixation capacity and is used in conjunction with a test for plant-available soil P to optimise fertiliser P requirements. For example, target levels for the Colwell P test, a measure of plant-available P, depend on the soil's PBI (Table 5, Appendix 6), with high PBI Ferrosols having higher optimum levels than the other soils which all have lower PBI.
An alternative test of plant available P in soils, the Olsen P soil test, has been assessed in trials to be a reliable indicator of available P for pastures on all soil types, independent of PBI. The Mehlich-3 P test adopted by some laboratories, can be used over a wider soil pH range (Blaesing 2017). The test results were found to be correlated to the Olsen P test in Iowa, USA, at pH's dominant in Tasmanian soils of less than 7.05, with the relationship being: Olsen P=2.1 + 0.47 Mehlich-3 P result can be regarded as being complementary to the Olsen P test, particularly where farmers also have comprehensive fertility histories of their properties based on the Olsen P test.
There was no increase in pasture production found when soil Olsen P concentrations exceed 23 mg/kg (0-75 mm depth) even under high production of 18.4 - 21.8 T DM/yr under rain-fed conditions in northwest Tasmania (Cotching and Burkitt 2011).
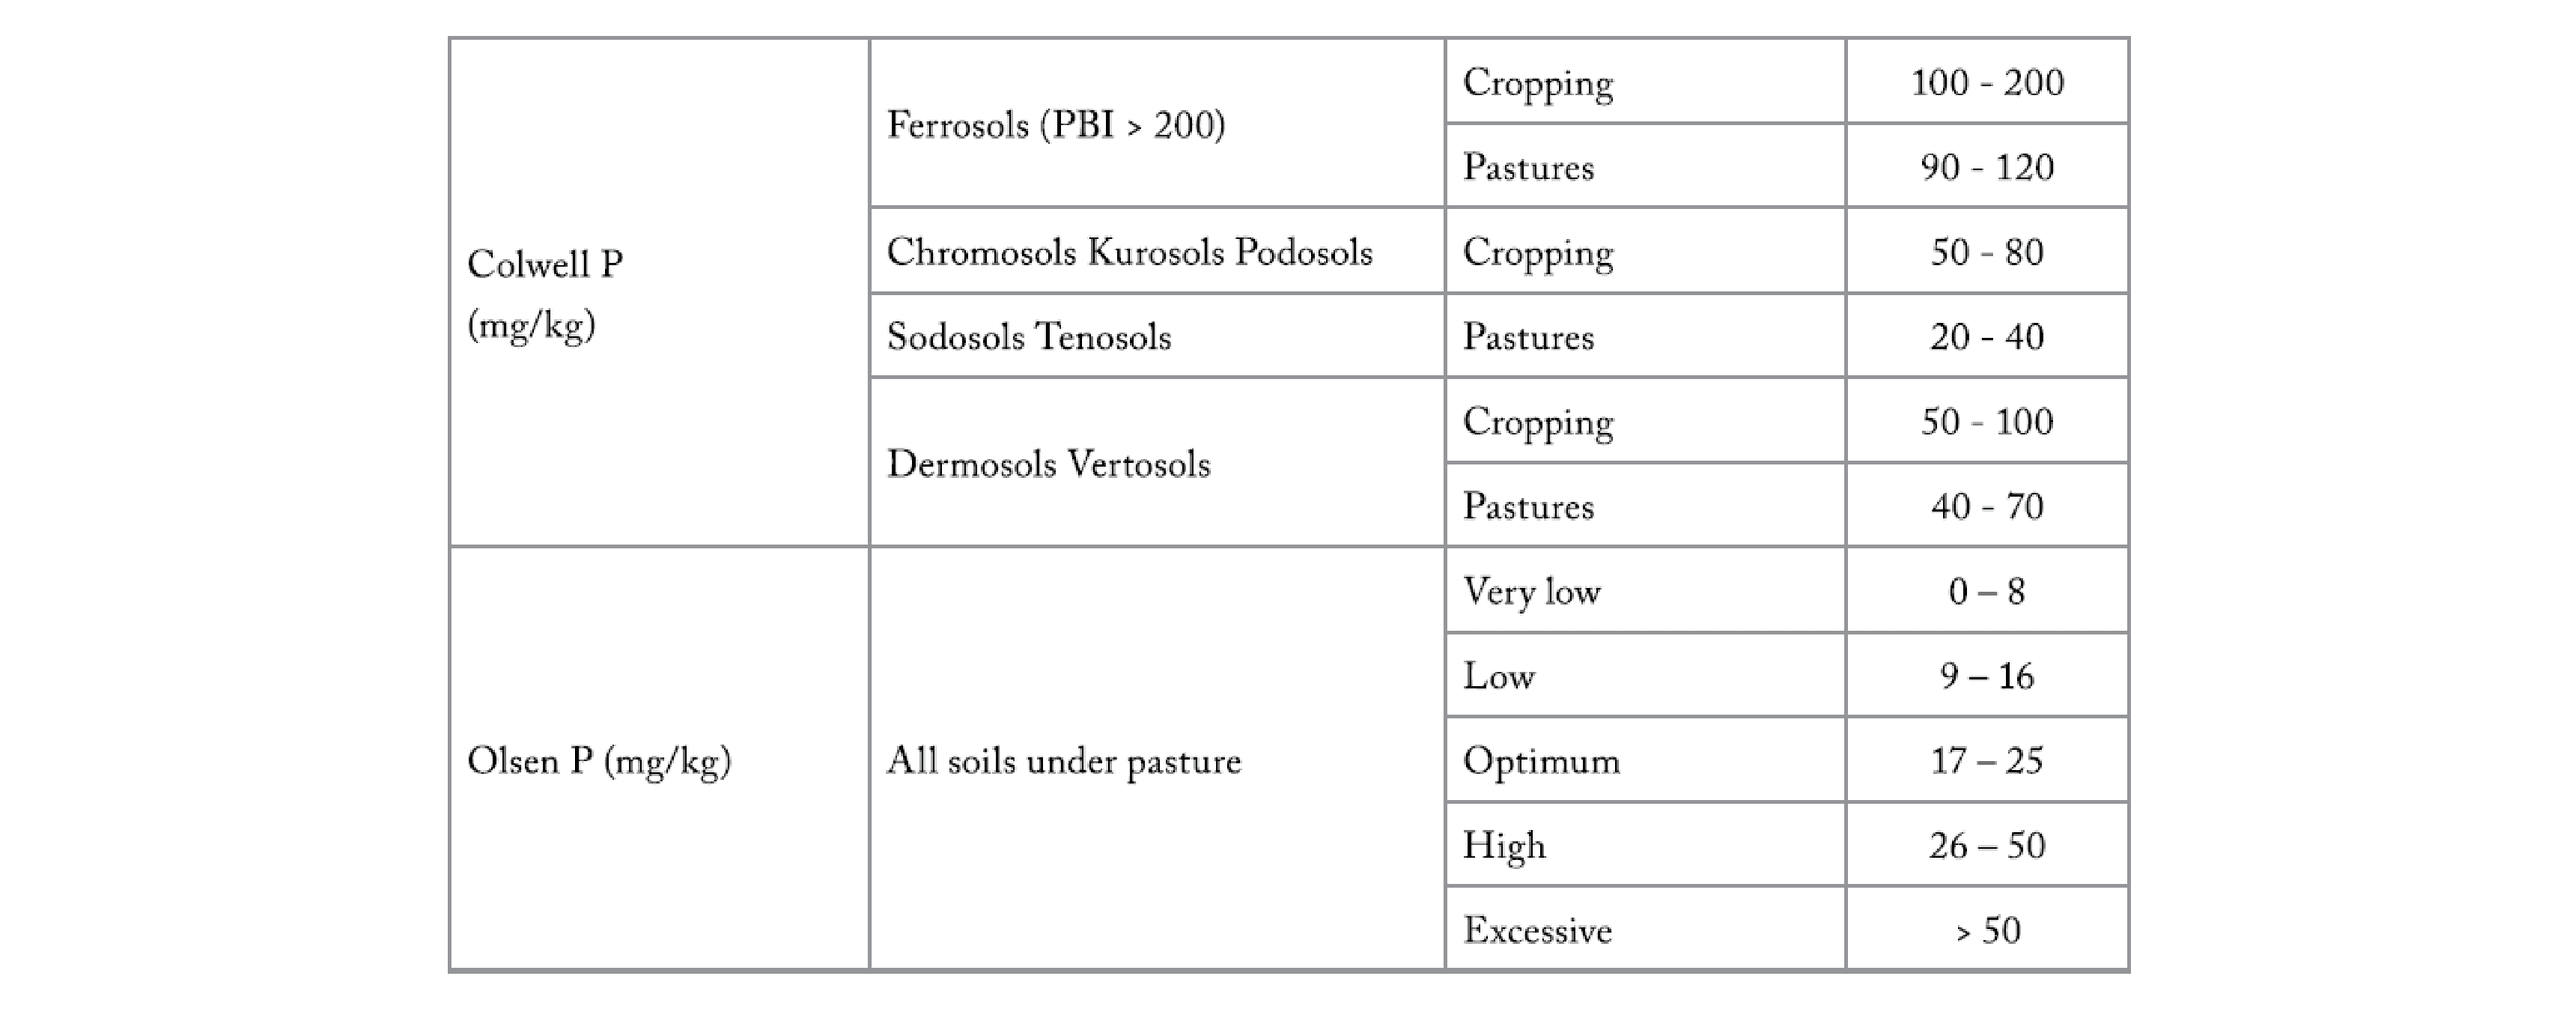
Table 5. Tasmanian optimum agronomic soil phosphorus levels (0-100 mm depth).
Phosphorus retention and removal
Phosphorus that is not removed from the soil system remains adsorbed by the soil or in organic matter. These sources all supply some P for plant uptake and thus maintain a residual fertiliser value. A long-term regime of applying P fertiliser decreases the capacity of the soil to adsorb and fix phosphorus, giving increased effectiveness of subsequent applications. Each crop species will remove different amounts of phosphorus from the soil in harvested product (Table 6, Appendix 2), and this must be accounted for during nutrient budgeting. Nutrient budgets and whole farm nutrient distribution maps are both essential tools for improved fertiliser management.
Several processes have been suggested to try and enhance the utilisation of phosphorus stored in the soil. These have included: plant selection for phosphorus scavenging plants, and plants with more abundant root systems, and promoting microbiological activity (Bailey 2011). Mycorrhizal associations may be able to reduce the total amount of phosphorus in the soil reserve by enhancing root exploration of the soil. However, mycorrhizal associations tend to proliferate under acidic soil conditions where total phosphorus levels are low and so are going to have little real effect in most agricultural regions of Tasmania.
| Crop | Phosphorus removed (kg) |
|---|---|
| Wheat | 3/T grain |
| Barley | 3/T grain |
| Lupins | 5/T grain |
| Canola | 7/T grain |
| Oat hay | 3/T dry matter |
| Grass pasture | 3/T dry matter |
| Potatoes | 0.5/T tubers |
| Onions | 0.3/T dry bulbs |
| Milk | 1/T liquid |
Table 6. Phosphorus removed in various crops.
Rate of soil phosphorus decline
Where soil P test levels are well above optimum, omitting P fertiliser or applying less than is exported in produce is likely to be an economically attractive option since there is no implementation cost and likely no production penalty. Decreases in Olsen P levels were found to be greater in soils with higher initial soil P levels and lower ongoing P fertiliser application rates (Coad et al. 2014). Even after over 4 years of not applying any fertiliser soil P levels remained well above optimum. However, if P fertiliser application is withheld for a period of years, regular soil testing is recommended, to ensure that soil P levels do not decrease below the recommended optimum.
Runoff losses
Phosphorus movement in soil varies depending on soil type, although it generally stays very close to where it is placed. Because fertiliser P is mostly applied on or near the soil surface, most P is found near the surface and concentrations decrease with depth. However, sandy pasture soils used for milk production in high rainfall parts of Tasmania have been found to lose large amounts of fertiliser applied P in surface runoff or surface drainage (Broad and Corkrey 2011; Holz 2010). Loss rates of 11 kg P/ha/year were found, but this loss can be minimised by applying P fertiliser during drier periods when the risk of surface runoff or drainage is minimal, i.e. during summer. Elevated concentrations of nutrients in water draining agricultural catchments, particularly N and P, have been associated with environmental problems such as eutrophication and algal blooms.
A phosphorus environmental risk index (PERI) that is the ratio of Colwell P to PBI provides information on the likelihood of soluble P leaching from the soil (Moody 2011). The Mechlich 3 Phosphorus ratio (M3PSR) can also be used to determine the environmental risk of phosphorus leaching. Both indicators are suitable indicators of leaching risk (Turner et al. 2013).
Fertiliser types
Single superphosphate (SSP - H2PO4-; 9 %P) is probably the traditional source of phosphorus fertiliser as it is one of the cheapest forms of phosphorus and contains calcium (19 %Ca) and sulfur (11 %S) as gypsum which is formed during the manufacturing process. Single super can be blended with other fertiliser products except urea and di-ammonium phosphate (DAP) as these products will react and become gluggy making them difficult to spread. The calcium content in SSP at 19% is often overlooked, which has probably been forgotten in the move to apply high analysis P fertilisers such as di-ammonium phosphate (DAP) (20 %P) and mono-ammonium phosphate (MAP) (22 %P). Every tonne of SSP contains 190 kg of calcium and 110 kg of sulfur. Without the regular application of calcium and sulfur containing SSP, calcium and sulfur levels can drop to below critical levels. The replacement of these two nutrients is often neglected in fertilizer programs for pasture and cropping systems in Tasmania.
SSP is normally broadcast spread and not applied in air-seeders as the proportion of finer particles in SSP may cause problems such as blockages and uneven flow in some air-seeders that are designed for more even-sized granules of high analysis products such as DAP or (MAP). Phosphorus fertiliser can be applied once per year and should be applied during drier periods when the risks of surface runoff or drainage are minimal.
Reactive phosphate rock (RPR) can be used as an alternative slow-release P fertiliser in high rainfall districts (> 1000 mm/year), but it is less soluble than conventional phosphorus fertilisers. RPR requires acidic conditions (pHwater < 5.0) to dissolve the mineral P. RPRs solubility, and thus its availability to plants, depends strongly on soil pH and the particle size of the material applied. Rock phosphate is more effective in acid soils than in alkaline soils, more effective when its particle size is fine than coarse, and more effective in the presence of mycorrhizal soil fungi (Hue and Silva 2000). RPR is better suited to grazing systems than cropping because crops require sufficient soluble P to be available to young plants because phosphorus promotes root growth. In colder areas available P during grain crop establishment assists with winter hardiness and stimulates tillering.
Placement of phosphorus
Agronomic benefits of banding P fertiliser on high P-fixing soils have been found in trials with potatoes and lupins, with this attributed to less soil coming in contact with the fertiliser. Wheat and canola have not responded to banded phosphorus on high P-fixing soils. Placing high rates of phosphorus less than 2 cm from the seed can reduce germination and establishment. Nitrogen-containing fertilisers (e.g. DAP) have been found to be more damaging to plant roots than superphosphate fertilisers.