- Current agricultural management practices are not resulting in soil acidification in Tasmania as lime or dolomite are applied as required.
- Sustainable soil P management requires a change in current practices.
Key points
Background
You can monitor changes and trends in soil nutrient levels over time on your paddocks by regularly sampling and testing your soils and maintaining good records so that management inputs can be adjusted. Looking at trends over time will provide more information than looking at a single moment in time soil test result.
Very few soil quality monitoring studies have reported on multiple samplings over the long-term. Monitoring soils over the medium to long term is the only way to measure the magnitude and direction of change in soil properties for assessment of soil sustainability (Billett 1996). The impacts of agricultural management on different soil orders in Tasmania have been assessed using field and laboratory techniques in studies that have substituted space-for-time, i.e. rather than monitor sites over a long time frame, many sites were selected that represented different histories of use which allows for understanding soil change over longer time frames (Richter and Markewitz 2001). This includes Dermosols (Cotching et al. 2002a), Ferrosols (Sparrow et al. 1999), Sodosols (Cotching et al. 2001), Tenosols (Cotching et al. 2002b) and Vertosols (Cotching et al. 2002c).
An important aspect of monitoring soil quality is setting target values for different soils and land uses in order to be able to evaluate results and to report on changes in soil properties over time due to the effects of management. The soil quality target for a particular soil is dependent on its inherent capabilities, the intended land use, and the management goals (Andrews et al. 2004). Examples of soil nutrient targets are given in Appendix 6. It should be noted that the targets are ranges rather than a specific value as each farm has different inherent characteristics, farming system and farmer constraints and objectives. If results are below target, this does not necessarily imply that a “threshold” has been reached where production will be dramatically reduced or even fail. If a result falls below the target value or outside the desired range, then the response should be to ask the question: “Is the result to be expected due to local conditions and are there likely to be undesirable impacts?” If the answer is that the result is “normal” or explainable by local soil profile information, then the response should be to continue monitoring. If the answer is that the result is not expected, then a management response is required in order to correct the soil condition. Such a response may include a change in rotation, a change in cultivation technique from conventional to minimum tillage, or the application of amendments such as fertiliser or lime. Invariably the questions will need to be answered with expert help from local advisers, agronomists or scientists (Cotching and Kidd 2010).
Soil pH
Current agricultural management practices are not resulting in soil acidification in Tasmania in monitored paddocks with no long-term detrimental changes in soil pHwater as shown by the comparison between long term pasture sites on Ferrosols sampled in the 1950s (Table 11). There are several reasons why acidification of Tasmanian soils does not appear to be as rapid as elsewhere in southern Australia. Tasmanian soils are already naturally strongly acidic. The generally moderate organic-matter content in Tasmanian soils buffers them against pH change. Tasmanian pastures generally contain a perennial grass that helps to restrict the loss of soil nitrate through leaching, a mechanism generally held to contribute to acidification in other parts of Australia (Sparrow et al. 2013).
Sites used for cropping have greater pHwater than pasture sites which is probably due to regular application of lime that is readily available in Tasmania at relatively low cost. Many of the crops grown (poppies, brassicas and onions) need higher soil pH than pastures. A slight increase in soil pHwater over time on the same Ferrosol sites from 6.0 in 1997 to 6.2 in 2010 has been reported (Sparrow et al. 2013) and from 6.1 to 6.3 five years later in topsoils of Dermosols (Grose 2015) which was attributed to application of lime or dolomite. This trend is of little concern because even the maximum pHwater found of 6.4 is still well below a level at which adverse plant growth consequences could be expected.
Phosphorus (P)
Most Tasmanian crop growers are reluctant to cut back on their rates of fertiliser because they know how responsive their crops can be, and they are unwilling to risk losing yield. However, no relationship was found between soil test and fertiliser rate, and growers generally applied more K and significantly more P than was removed in potato tubers (Sparrow et al. 1993). Most potato growers on Sodosols and Tenosols appeared to follow the P and K practices of their counterparts on Ferrosols despite successful demonstrations that such high rates are not needed on these soils and 90% of growers are using soil tests (Sparrow 2009).
Bicarbonate-extractable P (Colwell P) was found to have increased linearly as frequency of cultivation increased over a 38-year cultivation history (Figure 9) on Ferrosols (Sparrow et al. 2013). Cultivation history is in part a surrogate for associated practices of fertiliser and lime applications and the trend indicates that cropping is a significant agent of change. The current condition of these soils may be acceptable but the trend in their bicarbonate-extractable P concentrations is of potential concern for future productivity and environmental quality.
The strong P-fixing nature of Ferrosols has meant that P rates for vegetable crops of 100–200 kg ha−1 are common regardless of soil P status. Crop P removal is usually only about 10% of such rates and so it is not surprising that soil P concentrations continue to increase. If this trend continues, Tasmanian Ferrosols may yet reach a non-responsive P status.
It seems likely that Tasmanian vegetable growers apply more than maintenance fertiliser rates to many of their crops, not just potatoes. This is supported by soil test data since the 1960s (Table 12), which indicates a steady increase in extractable P and K.
There is direct evidence of elevated P levels entering the Tasmanian environment from agricultural land use (Broad and Corkrey 2011; Lisson and Cotching 2012). A strong positive relationship between dissolved reactive P in runoff and bicarbonate-extractable soil P has also been established in Tasmania (Burkitt et al. 2010). There is a need to better define critical Ferrosol P concentrations for Tasmanian cropping systems so that farmers have a clear target to aim for (Sparrow et al. 2013). Mistrust of soil tests and a lack of market or regulatory signals about fertiliser use may be barriers to better fertiliser practices (Sparrow et al. 2003).
| Depth mm | Long term pasture | Cropping with shallow tillage | Cropping (including potatoes) with more rigorous and deeper tillage | |
|---|---|---|---|---|
| Tenosols (Panshanger sand) | 0 - 75 | 5.7 | 5.6 | 6.1 |
| 75 - 150 | 5.6 | 5.4 | 5.6 | |
| Dermosols (Cressy shaley loam) | 0 - 75 | 5.6 | 5.6 | 6.0 |
| 75 - 100 | 5.5 | 5.7 | 5.8 | |
| Sodosols (Brumby sandy loam) | 0 - 150 | 5.4 | 5.5 | 5.5 |
| Long term pasture | Rain fed cropping | Irrigated cropping | ||
| Vertosols south east (Chruchill clay) | 0 - 75 | 6.4 | 6.0 | 6.5 |
| 75 - 150 | 6.2 | 6.2 | 6.6 | |
| Vertosols Midlands (Canola clay) | 0 - 75 | 5.6 | 5.5 | 5.8 |
| 75 - 150 | 5.7 | 5.4 | 5.8 |
Table 11. pHwater in Tasmanian soils used for agriculture (Cotching et al. 2001, 2002a, 2002b, 2002c Sparrow et al. 1999). * Data is mean of CSIRO sites analysed in 1950s and stored on DPIWE soils database.
| Depth mm/CSIRO sites* | Low input pasture | High input pasture | Intermittent cropping | Continuous cropping | |
|---|---|---|---|---|---|
| Ferrosols (Burnie clay loam) | 0 - 150 | 5.7 | 5.6 | 6.1 | 6.5 |
Table 11 * Data is mean of CSIRO sites analysed in 1950s and stored on DPIWE soils database.
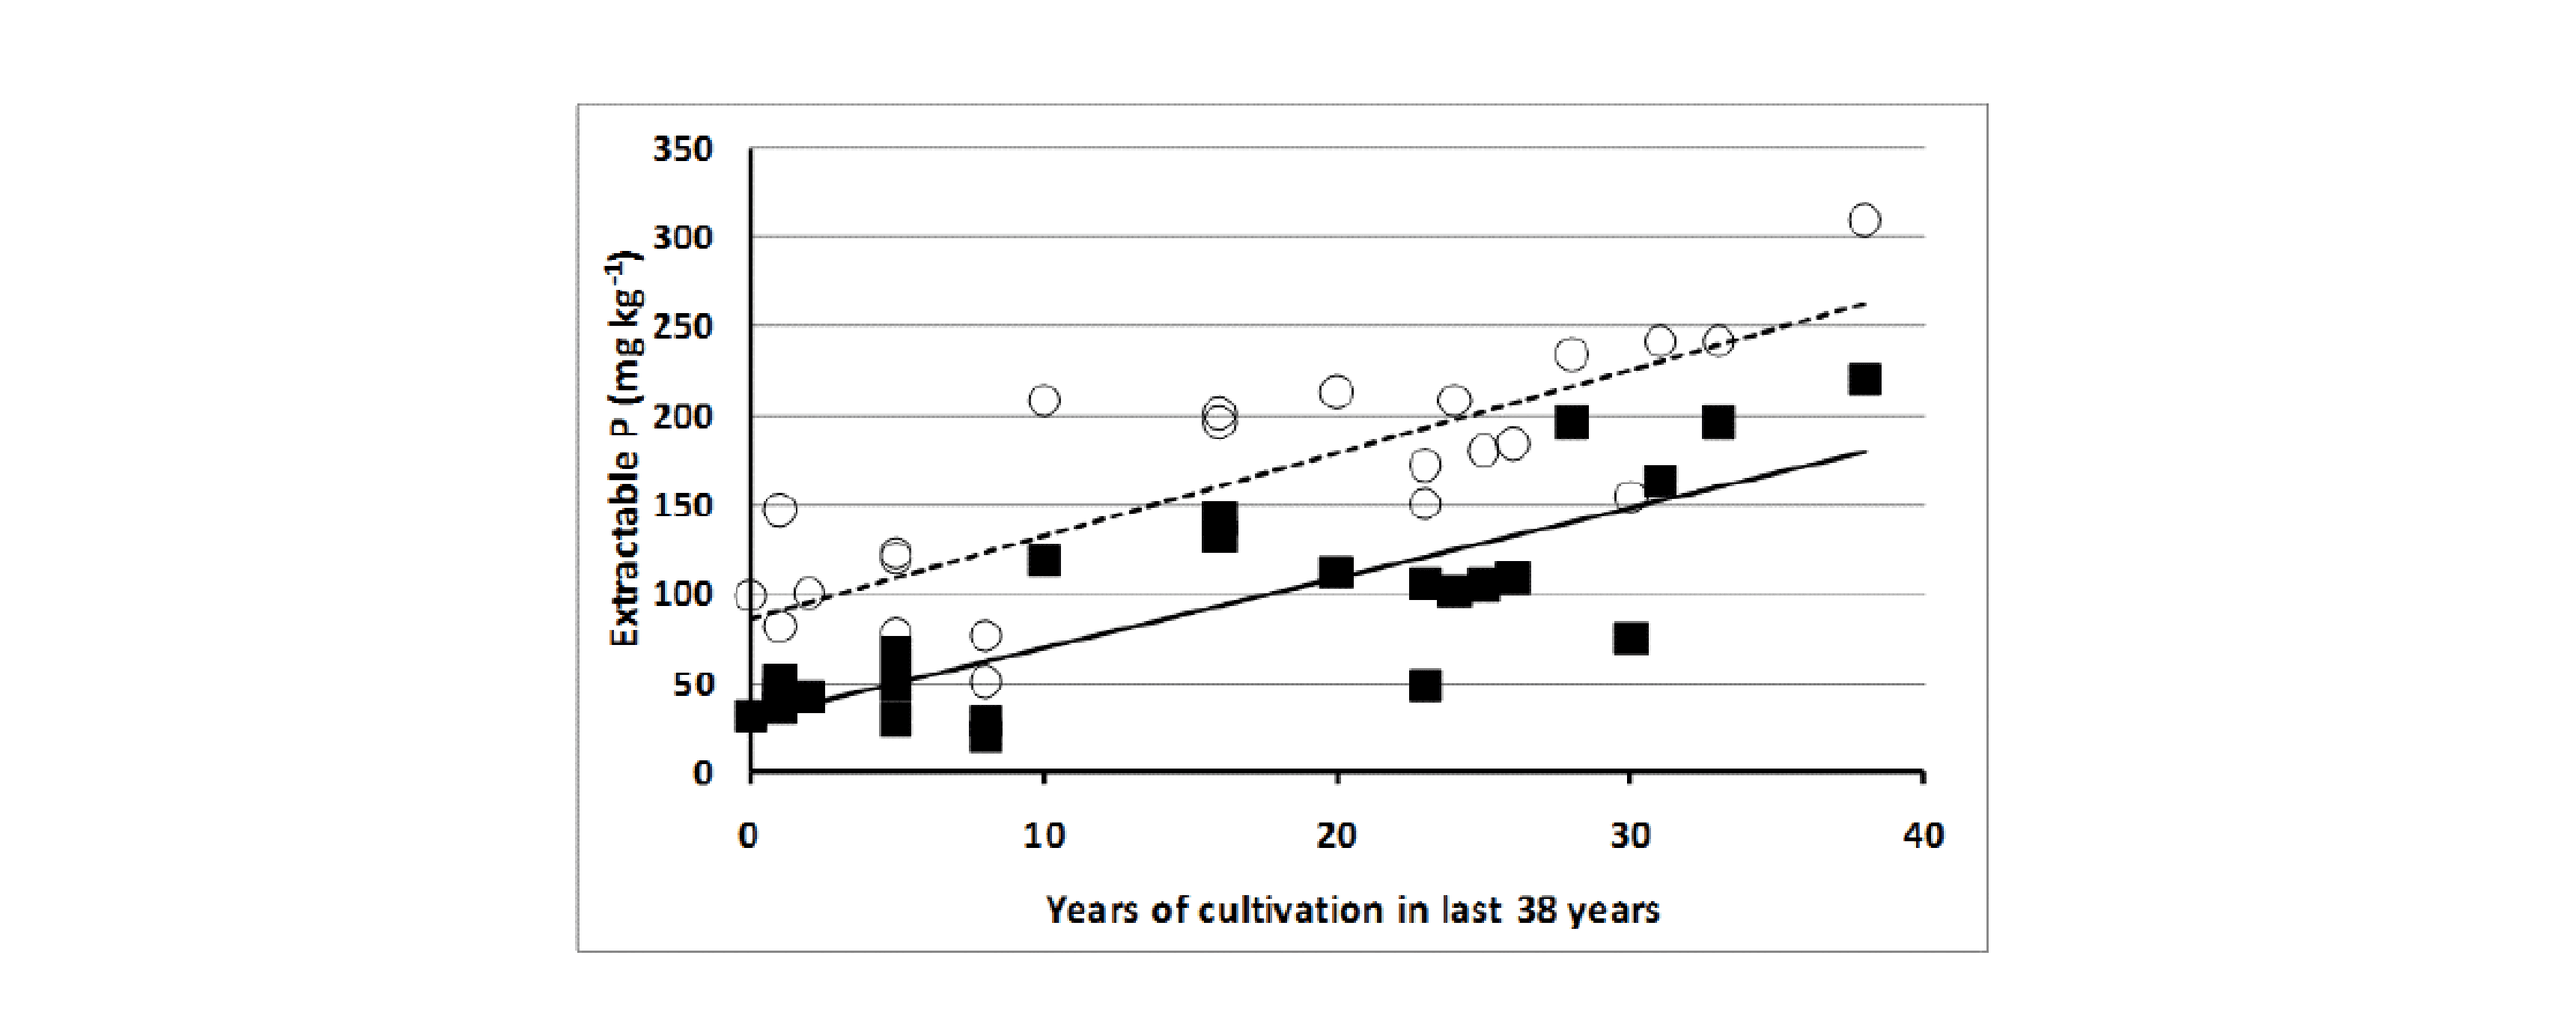
Figure 9. Relationship between bicarbonate-extractable P (Colwell P) and cultivation history for 0-150 mm (open circles, y=4.6263x + 86.11R²= 0.6755) and 150-300 mm depth (closed squares, y= 3.9252 + 30.681R²= 0.6428).
| Soil test | 1960s/ 16 Samples | 1980s/ 83 Samples | 2001/ 60 Samples | ANOVA/F-prob |
|---|---|---|---|---|
| Colwell P | 40 | 109 | 141 | <0.001 |
| Colwell K | 295 | 312 | 370 | 0.037 |
Table 12. Trends in extractable P and K of Tasmanian Ferrosol topsoils used for cropping (Sparrow et al. 2012).